The following data realizes the complete, 92-page report by Capstone Precision Group at a Lapua Rimfire test facility in an independent analysis requested by a NRL22 competitor comparing 5x .22 barrels at 50m and 100m in a mounted test fixture. The study comprised 2x Structured Barrels and 3x premium, conventional barrels. All barrels measured 25-inches in length with a 1.25-inch diameter (DIA). Thus, the Structured Barrels weighed approximately 1.5-2lb (or 23%) less. Customer and company names are redacted to not detract from the quality of the manufacturer.
Seven events were measured at each distance spanning the listed metrics: 1) DIA of Group 2) Max DIA Group 3) Min DIA Group 4) SD of Ave Group 5) ES Velocity 6) SD of ES Velocity 7) Max Velocity
Aggregating 100m results to clearly distinguish the two barrel types, Structured Barrels took 1st in 7 of 7 events shooting 16 lots of ammo from two manufacturers, despite being ~23% lighter than the heavier premium barrels. They demonstrated measurable gains in ballistic performance, particularly evaluating the SD of the average group and gain in muzzle velocity. Furthermore, the average of the two structured barrels produced a 2.57mm smaller max diameter than the average of the three conventional barrels, which is approximately half the bullet diameter in this test. Conducting a complex statistical analysis found the results to be significant at the 0.0121 level.
Due to the fact this independent data collection yielded unequal shots per group, this greatly complicated statistical analysis and called for data to be evaluated at raw and weighted values to discern variances. The analysis was further impeded by each group being organized into a separate mean radii per group center, failing to record group migration in the x-y planes lot to lot from a standard point. Based on these limitations, while there is no conclusive evidence that each Structured Barrel performed best, Johnson, an independent statistician found comparing the average of the Structured Barrels against the average of the non-structured barrels, found the 2.57mm smaller diameter group, almost half a bullet diameter, statistically significant at the 0.0121 level.
Johnson also found an unusual behavior in the direction the 𝑝-values trended that suggests there is a possibility each Structure Barrel is different than the other barrels. Under the null hypothesis of no difference in barrels, p-values should be randomly distributed as a uniform random variable between the interval [0, 1]. It is interesting that both Structured Barrels produced the lowest p-values, even though it would be unlikely to occur if the null hypothesis is true. Results and multiple figures corroborate the unusual behavior given as the number of shots increased, smaller the max diameter. This goes against what statistical theory would suggest as the number of observations increases, the more likely extreme values should appear; prompting further investigation.
Ballistic Performance Gains
Negative values indicate smaller groups and/or SDs. Positive values indicate bigger groups and/or SDs.
100m
DIA of Group
-5.80%
Max DIA Group
-5.02%
Min DIA Group
-0.57%
SD of Ave Group
-37.45%
ES Velocity
-5.21%
SD of ES Velocity
-7.49%
Max Velocity
+3.12% (28.67 ft/s)
Statistical Analysis
By Johnson
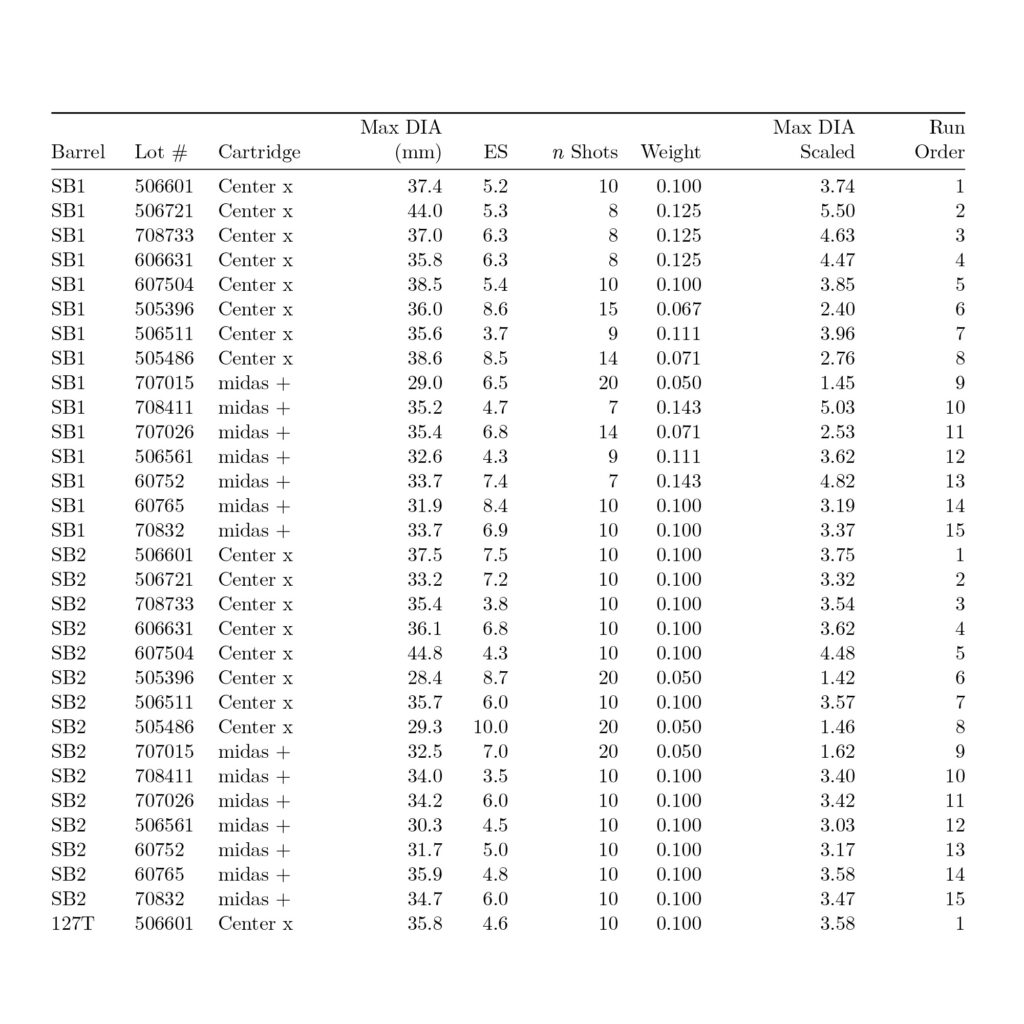
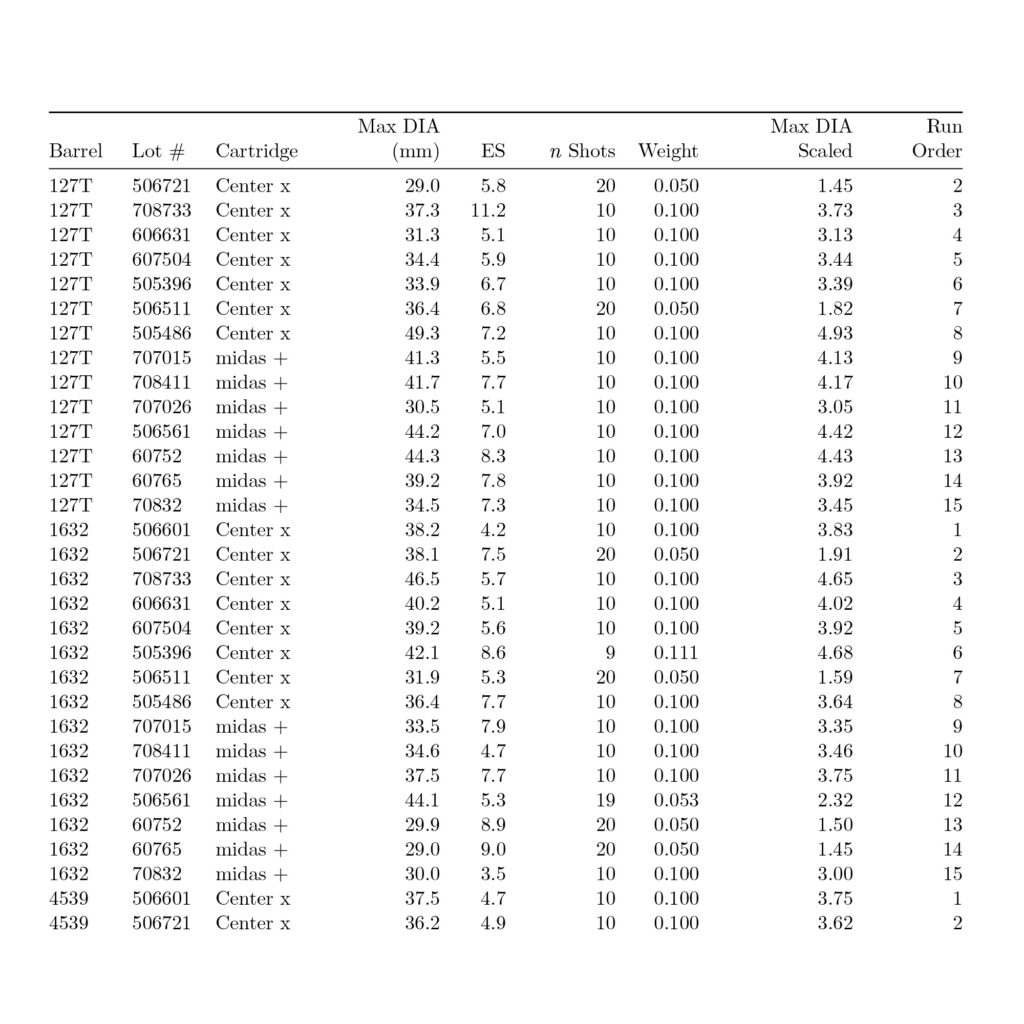
The following analysis and modeling of data is provided for five barrels to test the Lapua cartridge/lot combination for the max diameter (mm). Two of the barrel were structured barrels by TACOM HQ. Some acknowledged issues include not all cartridge/lot combinations were shot with the same number of observations. This complicated analysis, but weighted statistics, were used to help give priority to max diameters that were shot at larger sample sizes.
Analysis
Below are some tables and figures of the raw max diameters and weighted max diameters. The weight used was 1/𝑛𝑖𝑗 where 𝑛𝑖𝑗 is the number of observations per the 𝑖-th barrel of the 𝑗-th cartridge/lot combination. Exploratory analysis with plots will occur at the lowest level of barrel, cartridge, and lot combination and at a higher level where only the barrel is considered.
Next, raw and weighted data was subjected to various T and F tests to assess observational probability. T tests evaluate a single variable, while F tests determine whether a group of variables are jointly significant. This enables the variation between groups and within a group to be compared, respectively. Traditionally, a p-value of 0.05 or lower is considered statistically significant as this renders the confidence in the difference in data/observations between two groups is not noise, but signal. Values larger than 0.05 finds there is insufficient data to conclude the two samples are running on their own trend lines. Results closer to 1 prove an increasingly similar 1:1 comparison. It is important to note, while a F test may yield statistical significance, this is always contrasted to a p-value to determine if all, combined variables are significant.
Table 2: This table provides weighted summary statistics based on max diameter. The weight used was 1/𝑛𝑖𝑗 where 𝑛𝑖𝑗 is the number of observations per the 𝑖-th barrel of the 𝑗-th cartridge/lot combination. Note, the lesser Weighted Means and SDs.
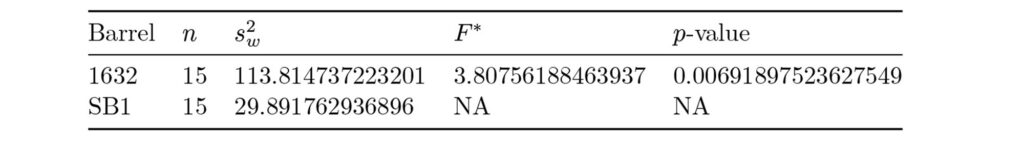
Table 3: This table provides the results from a two-sample variance test comparing the maximum and minimum weighted max diameter sample variances. Note, the 0.006 p-value. In other words, there is a six-in-1,000 chance of observing results at least as extreme. This is statistically significant.
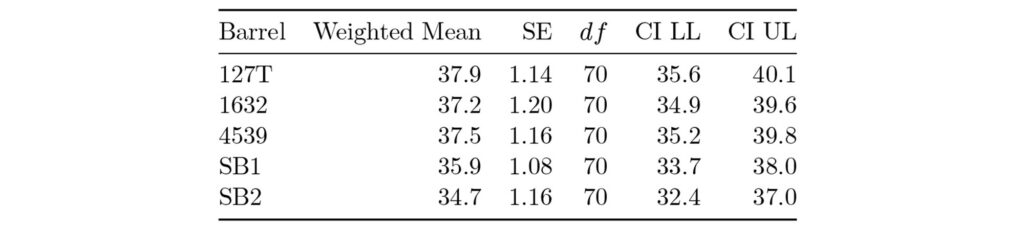
Table 4: This table provides weighted means of max diameter. The weight used was 1/𝑛𝑖𝑗 where 𝑛𝑖𝑗 is the number of observations per the 𝑖-th barrel of the 𝑗-th cartridge/lot combination. Standard errors are constructed from weighted residuals of least square means. Note, the similar Standard Error (SE) and minimums for the Confidence Interval (CI) at a Lower Limit (LL) and Upper Limit (UL) to describe the Max Diameter.
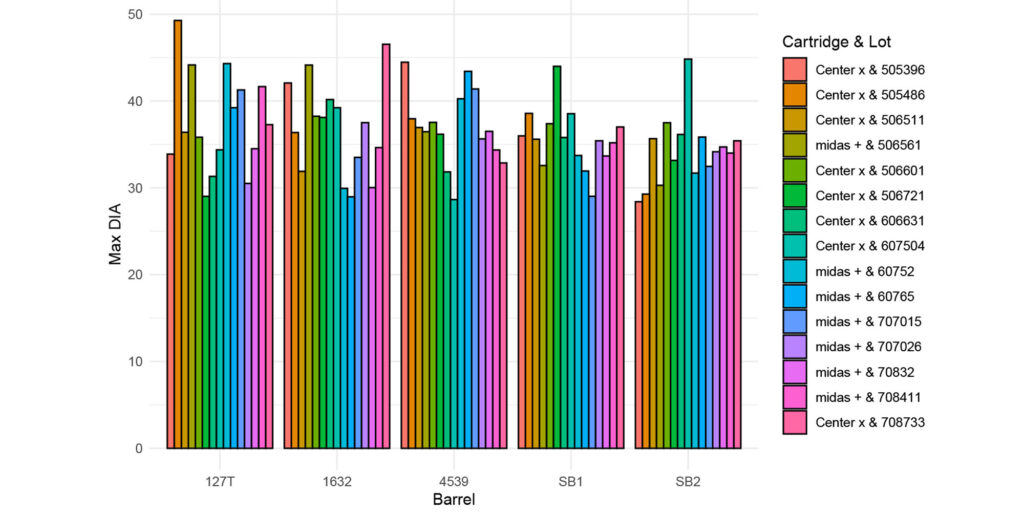
Figure 1: This figure provides the raw max diameter given the barrel and cartridge/lot combination. Note, when a 40mm limit is applied, both Structured Barrels yield a greater tolerance across the cartridges.
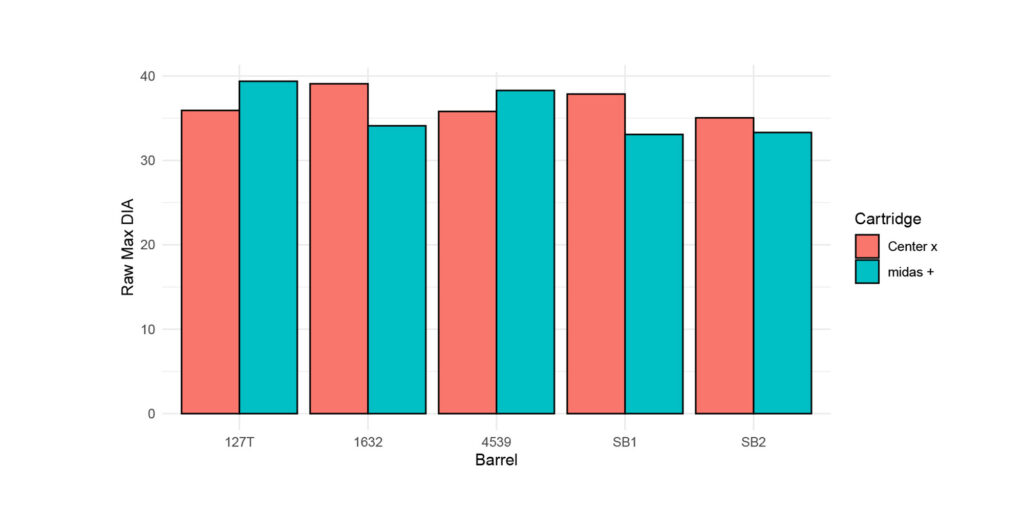
Figure 2: This figure provides the raw max diameter given the barrel and cartridge (averaged across lot).
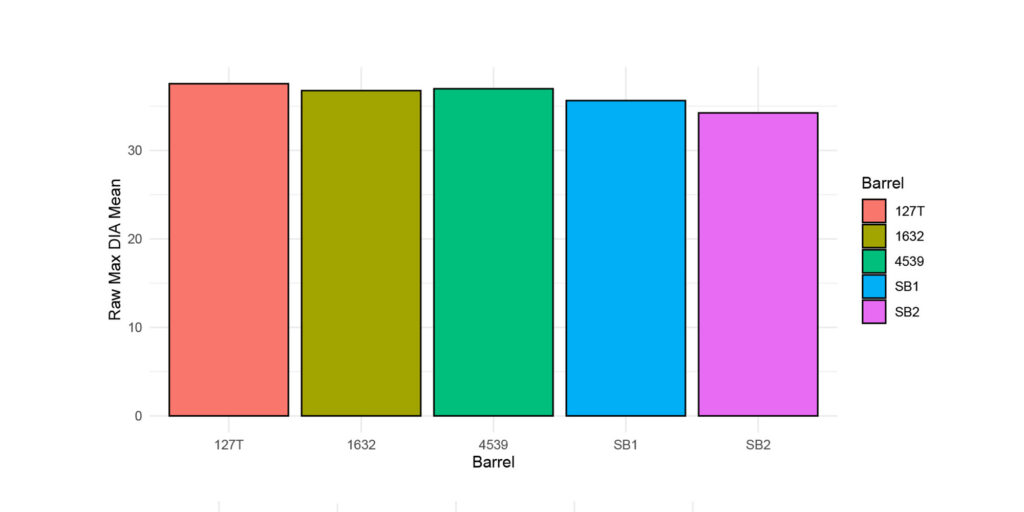
Figure 3: This figure provides the raw max diameter given the barrel (averaged across the cartridge/lot combination). Note, the barrels with the lesser raw max diameter mean.
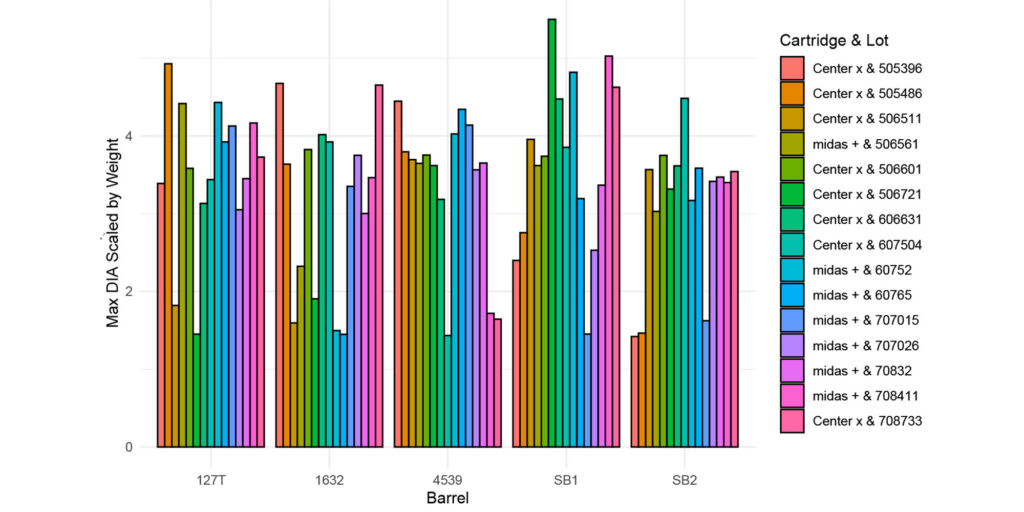
Figure 4: This figure provides the max diameter scaled by weight given the barrel and cartridge/lot combination.
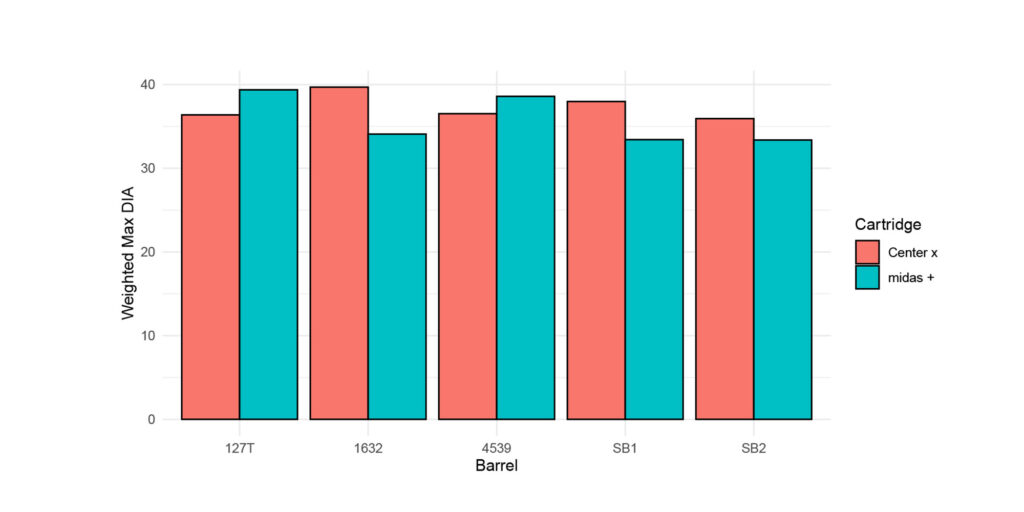
Figure 5: This figure provides the raw weighted diameter given the barrel and cartridge (averaged across lot).
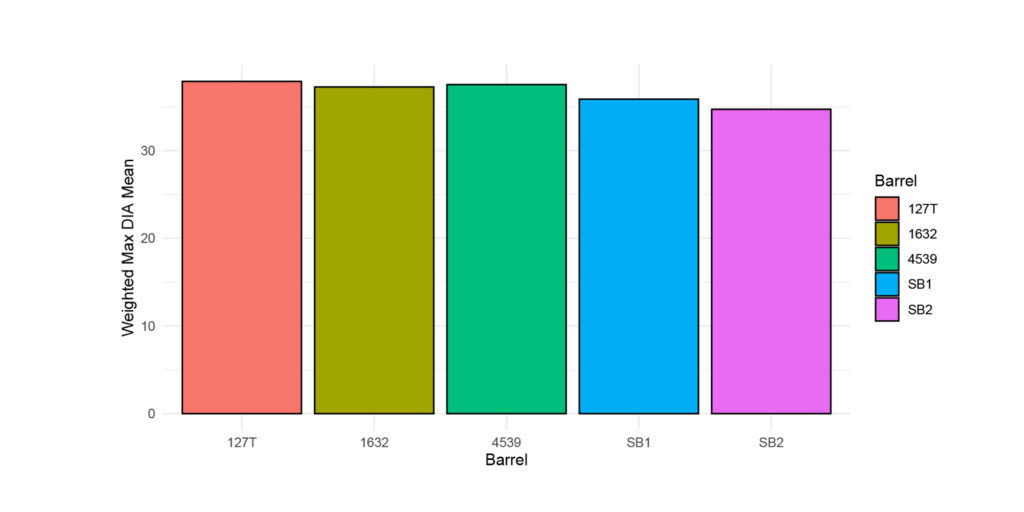
Figure 6: This figure provides the weighted max diameter given the barrel (averaged across the cartridge/lot combination). Note, the barrels with the lesser weighted max diameter mean.
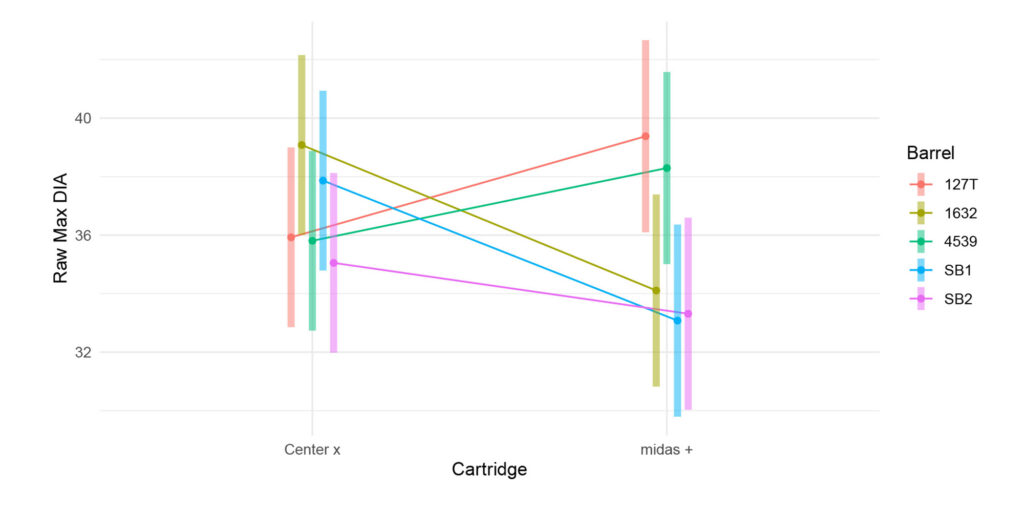
Figure 7: This figure provides the raw max diameter given the barrel and cartridge/lot combination with 95% confidence interval.
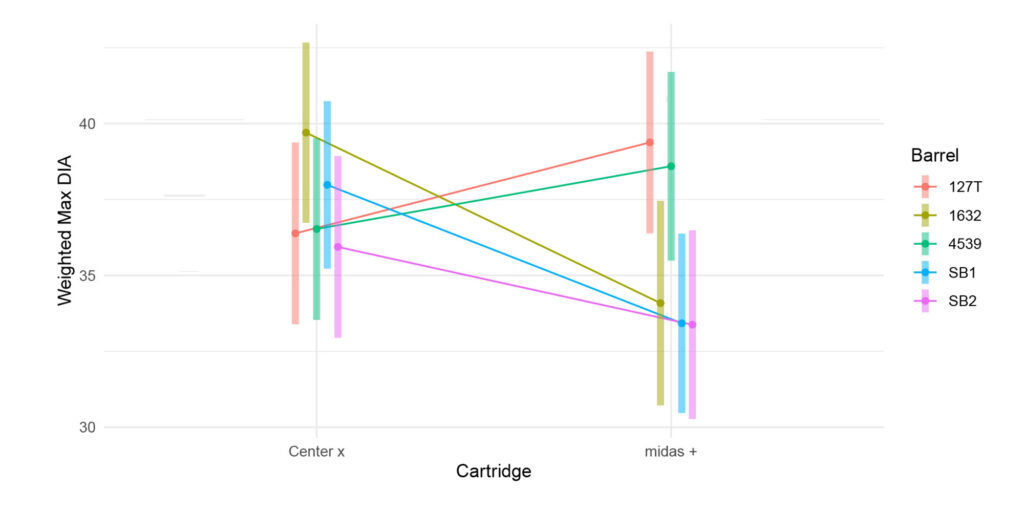
Figure 8: This figure provides the weighted diameter given the barrel and cartridge/lot combination with 95% confidence interval.
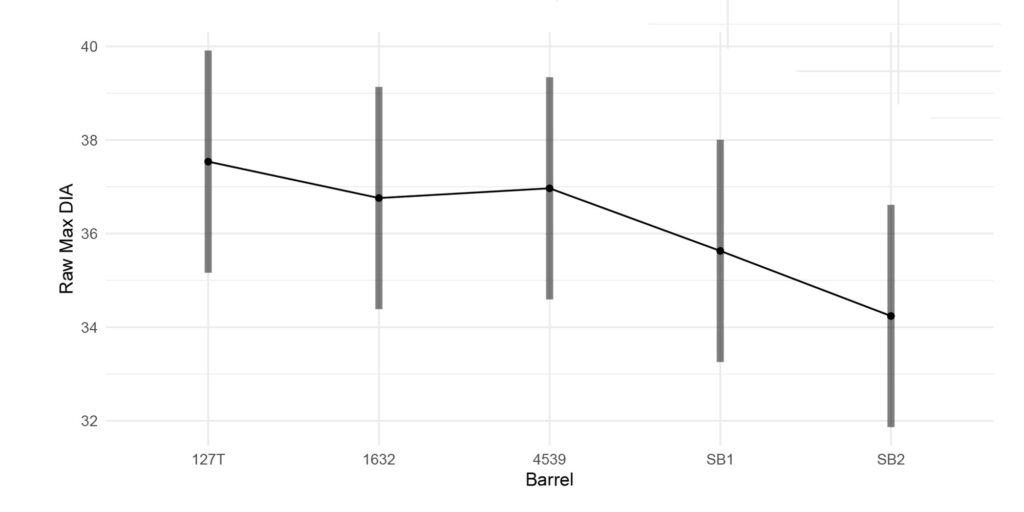
Figure 9: This figure provides the raw max diameter given the barrel with 95% confidence interval. Note, if a 36mm diameter limit is applied, both Structured Barrels yield a smaller max diameter.
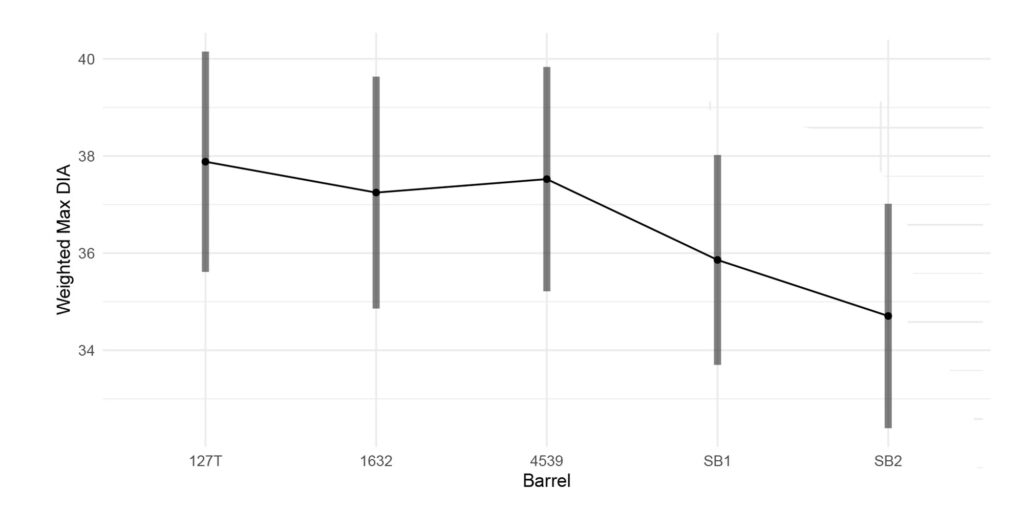
Figure 10: This figure provides the weighted max diameter given the barrel with 95% confidence interval. Note, if a 36mm diameter limit is applied, both Structured Barrels yield a smaller, weighted max diameter to account for difference in n-shots.
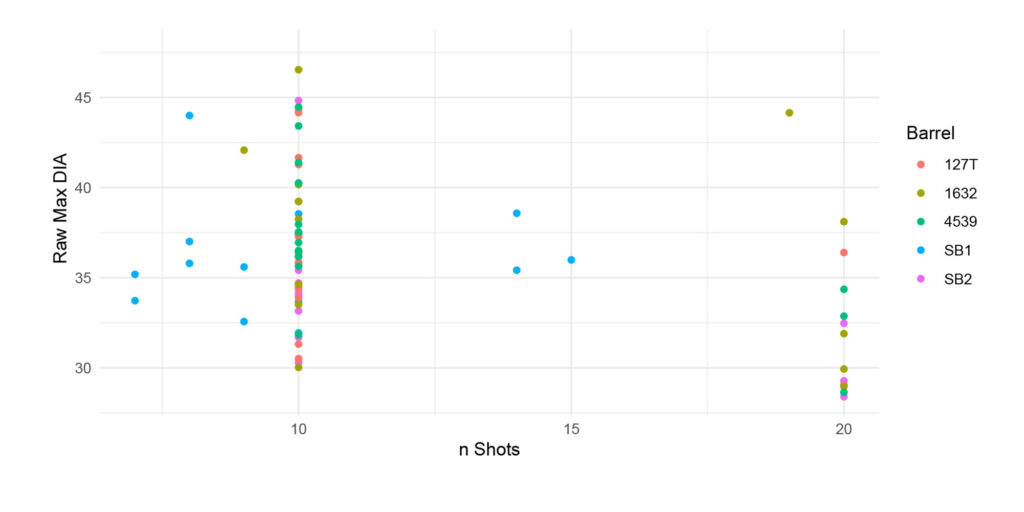
Figure 11: This figure provides the raw max diameter given the 𝑛 shots and barrel.
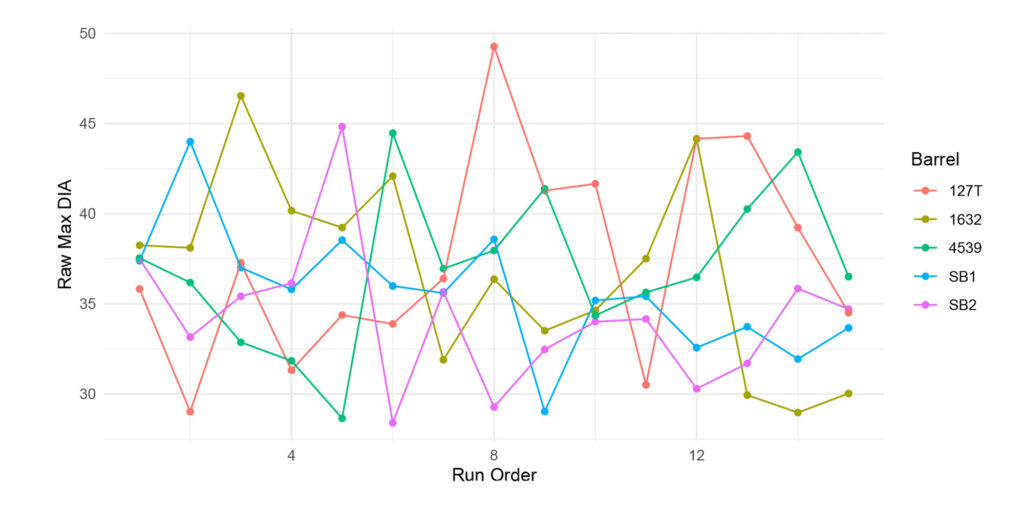
Figure 12: This figure provides the raw max diameter versus their order to assess (any) correlations. Note, the consistency and/or variation in a comparative raw max diameter per barrel.
Models
The following provides ANOVA and regression models.
Table 5: ANOVA table of the weighted max diameter with barrel and cartridge as factors.
Table 6: ANOVA table of the weighted max diameter with barrel as a factor.
Table 7: ANOVA table of the raw max diameter with barrel as a factor and 𝑛 shots as a covariate.
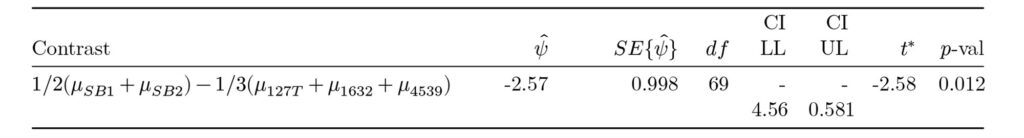
Table 8: Results from a complex contrast that compares the average of the structured barrels against the average of the non-structured barrels. Note, on average, the average of the two structured barrels produced a 2.57mm smaller max diameter than the average of the three unstructured barrels, which is almost half a bullet diameter.
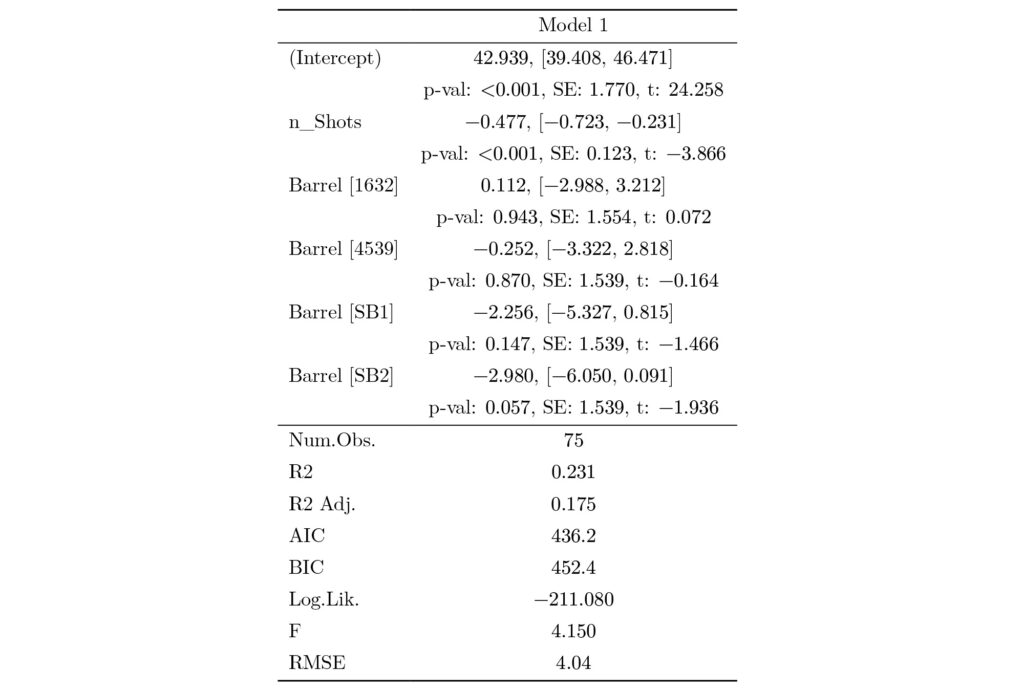
Table 9: Raw max diameter regressed on 𝑛 shots and barrel. Barrel 127T is the overall baseline and included in the intercept (127T was arbitrarily chosen, but a baseline is required for the design matrix to be invertible). All other barrels are compared against the baseline. Weighted max diameter was not used because it was constructed from 𝑛 shots.
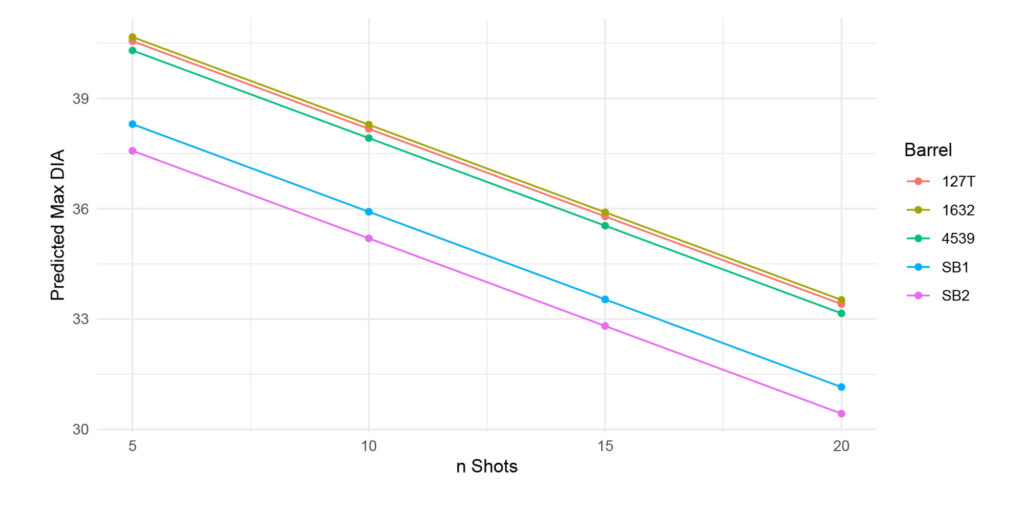
Figure 13: Predicted max diameter based off Model 1.
Discussion
In terms of variances of weighted max diameters, SB1 had the lowest sample variance. Table 3 shows the results comparing barrels with the minimum and maximum variances. There is a significant difference between SB1 and 1632, but there is not a significant difference in variances between SB1 and the rest of the barrels (not shown).
The figures previously shown suggests there was not any obvious relationships in the data when comparing the raw or weighted max diameter to the factors barrel or cartridge. Table 5 used barrel and cartridge as factors and Table 6 used the barrel as a factor. In either case, there were no significant differences detected among the factors and the weighted max diameter. Table 7 shows an ANOVA model where barrel is a factor and 𝑛 shots is a covariate. The number of shots is a significant predictor for the size of the raw max diameter. However, the barrel factor is not significant.
Table 8 shows the results form a complex contrast that compares the average of the Structured Barrels against the average of the non-structured barrels. On average, the average of the two structured barrels produced a 2.57mm smaller max diameter than the average of the three unstructured barrels. This complex contrast is statistically significant at the 0.0121 level.
Using raw max diameter and regressing it on 𝑛 shots and barrel produced the results in Table 9. The number of shots had explanatory power about the max diameter. Additionally, SB2 was almost significantly different from the other barrels at the 5% level. SB1 was the next closest barrel in terms of a lower 𝑝-value, but not close enough to suggest any significant difference. However, under the null hypothesis of no difference in barrels, p-values should be randomly distributed as a uniform random variable between the interval [0, 1]. It is interesting that both structured barrels had the lowest p-values even though it would be unlikely to occur if the null hypothesis is true. So, while there is not conclusive evidence that the Structured Barrels performed the best, but there is unusual behavior in the direction the 𝑝-values trended that suggests there is a possibility the structure barrels are different than the other barrels. Figure 13 shows the behavior that as the number of shots increase the smaller the max diameter. Figure 11 provides the same conclusion from the raw data. These two figures and the data go against what statistical theory would suggest when the number of observations are increased. As the number of observations increase, the more likely extreme values are to appear. So, why does max diameter decrease as the number of observations in a group increase?
It would be advisable to select the desired number of shots per group and then use that number for every group shot for every barrel. Having unequal shots per group complicates analysis.